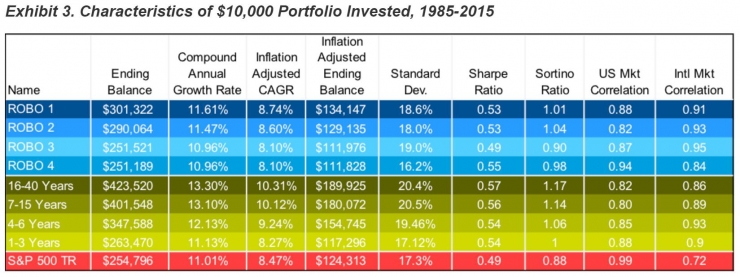
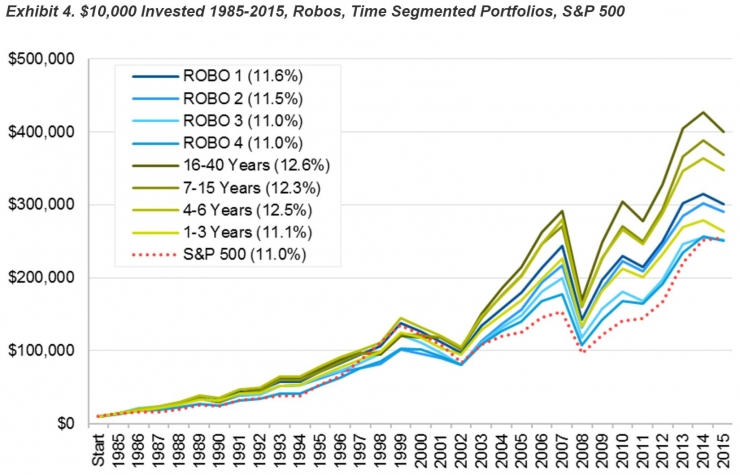
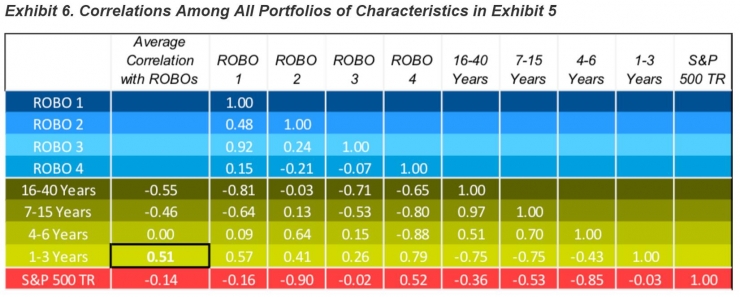
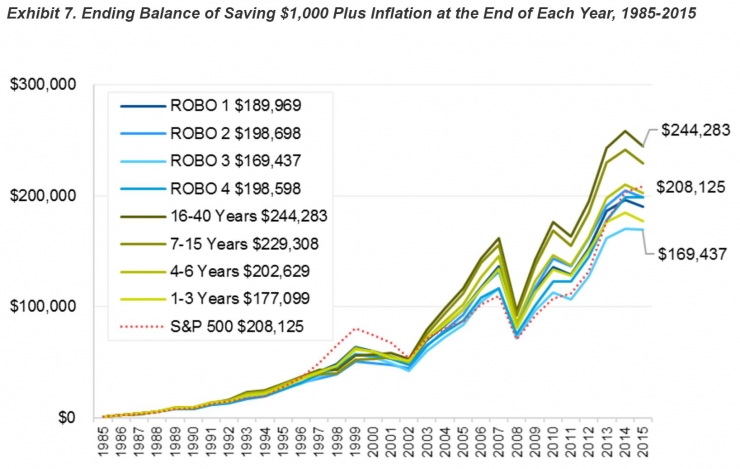
The Robo advisor is considered to be one of the most disruptive technologies in the Fintech field. However, although technology will have a certain impact on financial services, investment advice needs to be determined by the quality of its investment advice in order to become a new model. A recent study showed that mainstream smart investment advice has the problem of misplaced investment advice and user needs, and unlike investors' expectations, they are more like short-term investment plans. The two researchers, Stephen J. Huxley and John Y. Kim, found that the effectiveness of asset allocation for smart investing is more consistent with short-term equity portfolios. When time division (referring to the expected investment cycle) is included in the assessment, smart investment is a stock asset recommended by “robust†investors and has the strongest correlation with the investment portfolio of the 1-3 year investment cycle. From the perspective of time division, short-term does not mean frequent transactions, but it means that the portfolio will mainly include stock assets that may have better returns in the short term, which of course ignores the possibility of better long-term earnings. Most financial advisors will stress that lifelong planning should focus on long-term benefits. One of the indicators in the investment strategy is time. However , it is difficult to evaluate the investment performance of smart investment advisers in a fair manner, especially when it is only recently that there are few historical records. Most machine investment strategies are too novel to be effectively compared. However, it is gratifying to note that smart investment advisers often announce the distribution of funds in the portfolio and the status of funds. And although the configuration will change, it will be relatively stable, and the change of any asset class between 2016 and 2015 will be only a few percentage points. In 2017, it may change a little bit, but overall it can be seen that the asset allocation method of smart investment advice is strategic, not tactical. The stability of the portfolio and the record of various asset classes over the past 30 years also make it possible to analyze the performance of smart investment portfolios over a longer period of time. Huxley and Kim's comparison also has a premise that the age of intelligently looking users is usually under 40 (as is the case in the United States) and assumes that the investment objective is to prepare for retirement, that is, pay more attention to long-term investment income. Of course, another point worth considering is that each company's risk assessment scale can effectively reflect the user's risk appetite, but this can only be used as an earlier assumption. The purpose of Huxley and Kim's research is to investigate the state of asset allocation that smart investors recommend in the context of an investor's request for long-term financial planning. They compared the equity assets of the four company smart investment portfolios of Betterment, Motif, Schwab, and Wealthfront , and the investment target time period is from 1 to 40 years. The time span of the data is the past 31 years (1985-2015), and the investor type is assumed to be "robust". For investment targets, one of the smart bidders is about 50% stocks, and the other three are about 70% to 80% stocks (including a small amount of commodity futures, REITs, and gold), and only stocks and stocks The column's asset allocation will be included in the analysis. This is so because it is possible to make near-equivalent comparisons in the recommendations of different candidates. Moreover, the stock portion of the portfolio will often be the long-term driver of overall earnings growth. Time-slicing is a mathematical programming method used to select asset allocations for 1, 2, 3, and 40-year holding periods. The final analysis of the stock model is divided into four time periods: 1-3 years, 4-6 years, 7-15 years, and 16-40 years of investment cycle. The asset portfolio for each investment cycle comes from another study by Huxley and Kim. As a result, it was found that the investment portfolios recommended by the speculators were indistinguishable from the performance of the S&P 500 Index. Nothing better or worse. However, all investment advisers have one thing in common: they are essentially short-term investments. In asset allocation, their portfolio has the highest correlation with a short-term stock portfolio of 1-3 years, rather than a long-term portfolio. The specific analysis results are as follows. The figure below shows the static case results of smart investment, which invested 10,000 U.S. dollars in the beginning of 1985, and did not raise any additional investment until the last year of 2015 (except for stocks with red bonus). The results will be compared with the results of each investment cycle and the S&P 500 index. It can be seen that the performance of each investment is no different from the S&P 500 index. Figure I. Comparison of revenues of smart investment and investment cycles with the S&P 500 index under static investment conditions The chart below is the cumulative result of each portfolio in Figure 1. It can be seen that there is no significant difference in the performance of the blue-labeled smart bidders, of which two are slightly better than the S&P, and two are slightly worse. More importantly, the chart shows that the stable investment portfolio of the investment advisers is more similar to the combination of investment cycles of 1-3 years. In other words, investment advisers are more likely to be making short-term investments, although the investment portfolio in the survey is designed for long-term investment. Figure II. Cumulative income results for each portfolio The data in Figure 1 can also be used to do a correlation analysis between smart investment and investment cycles. As shown in Figure 2, the following figure also shows that the average positive correlation between the investment cycle and the intelligent investment in the 1-3 years is the highest, which is 0.51. The average correlation of the investment cycle in 4-6 years is zero, 7-15 years. The 16-40 year investment cycle has a negative correlation. This once again shows that the smart investment portfolio seems to be designed for short-term investment. Figure 3. Correlation analysis of various smart investment and investment cycles The chart below shows the performance of each portfolio under the dynamic scenario, ie, an additional investment of US$1,000 per year. The first additional investment was made at the end of 1985 and is added at the end of each year. The final results show that the conclusions are similar to those of static investment. Smart investment advisers are more similar to the performance of investment cycles of 1-3 years and 4-6 years. Figure IV. Cumulative investment performance of various portfolios under dynamic scenarios The overall conclusion is that if a stable investor invests on smart investment advice, the income generated after 31 years is not comparable to the investment portfolio established for long-term investment. The intelligent investment adviser will recommend the optimal investment portfolio for the user based on the results of the risk preference scale. But the premise is that the scale is real and effective, and the results are indeed disappointing. Some companies' scales do not even ask the user when to withdraw from the investment. Misadventures between smart advice and user financial planning can lead to unnecessary losses. In the United States, smart users are usually in their early 30s to early 40s. Such users usually have long-term investment goals for retirement. Therefore, their expected investment portfolio should also be long-term oriented. If the smart venture company's risk scale is accurate enough to measure the user's risk appetite, then there is a problem with the investment recommendation. If the scale is not as effective as the imagination, then there is a problem that the smart recommendation does not match the user's preferences. This may be the problem that the petitioners should solve first. To learn more about Huxley and Kim's research, you can go here. Recommended reading: BlackRock: Smart Speculators should fully disclose algorithms and protection measures Measured: Under the same risk rate, what are the differences in the benefits of smart investment? Safety Light Curtain,Safety Curtain,Laser Safety Light Curtain,Safety Optic Light Curtain,Security Light Curtain,Press Brake Safety Light Curtains Jining KeLi Photoelectronic Industrial Co.,Ltd , https://www.sdkelien.com
Assumptions
Data Sources
Analysis results
Focus on short-term gains? Mainstream smart investors are essentially short-term investments
SDKELI has been manufacturing safety light curtains for more than 20 years. Its brand [SHANGSHOU" and [SDKELI" owns largest market share in China because of reliable quality and proper price. All the safety light curtains are type 4 with CE certificate.