At present, RF front-end technology has become a very important and active research direction in the field of system chip design and manufacturing. As a key technology of RF front-end, RF amplifier is a topic worthy of further study. In mobile communications (GSM and 3G), satellite global positioning (GPS), wireless local area network (WLAN) and radio frequency identification (RFID), the operating frequency has reached the GHz frequency band, requiring RF front-end technology, RF amplifier as RF front-end technology The core of the issue has caused widespread concern. In RF receiving systems, amplifying the signal under low noise is a basic requirement for the RF front end. The noise figure and gain of the amplifier need to be considered. At the same time, due to the volatility of the RF circuit, the amplifier needs to consider stability and standing wave. Therefore, the design of the RF amplifier is also subject to more stringent requirements. In this paper, a distribution scheme of small-signal RF amplifier is proposed based on the complex plane circle diagram. The input and output standing wave ratio, gain and noise figure of the RF amplifier are in conflict with each other. The indicators can not be optimized at the same time. The optimal conditions for the single parameter are given, and the allocation scheme for improving the comprehensive performance of the RF amplifier is proposed. And give the simulation curve and simulation results analysis. 1.1 Stability Due to the presence of reflected waves, the RF amplifier has a tendency to oscillate at certain terminal conditions or operating frequencies, causing instability and no longer functioning as an amplifier. The stability of the amplifier can be determined graphically or analytically. The graphical method is to observe the relative position of the stable discriminant circle and the Smith chart. When the amplifier is absolutely stable, the stable discriminant circle contains the Smith chart or the stable discriminant circle is completely located in the Smith chart. Outside; the analytical method is to calculate the stability factor, and the absolute stability requires the stability factor k"1. 1.2 gain The conversion power gain of the amplifier is: In the formula: 1.3 Noise figure The noise figure is determined by the ratio of the nominal signal-to-noise ratio at the input of the amplifier to the nominal signal-to-noise ratio at the output. For amplifiers, the presence of noise has an important impact on the overall design. Amplifying the signal with low noise is a fundamental requirement for the amplifier. The noise figure of a two-port amplifier can be expressed as: 1.4 Input and output standing wave ratio The degree of mismatch between source and transistor and between transistor and load is described by the input-to-output voltage standing wave ratio. In many cases, the VSWR of the amplifier must be kept below a certain specification. The input and output voltage standing wave ratios of the amplifier are: 2.1 Single parameter reaches the optimal condition (1) The gain is optimally related to both the input and output matching networks. When the input matching network and the output matching network can ensure that the input and output of the transistor respectively achieve the conjugate match (2) The noise figure is optimal only related to the input matching network. The noise figure can be expressed as: (3) The VSWR is optimal and the input and output matching networks are all related. Source mismatch factor 2.2 Distribution plan The method for analyzing the distribution based on the complex plane circle diagram is as follows: (1) Draw an equal gain curve on the chart. Draw the equal gain curve of the input matching network and the equal gain curve of the output matching network on the circle graph. Their curve equations are: In the formula: (2) Draw an equal noise curve on the chart. The equation for the equal noise curve is: When the small signal is equal to the noise figure curve, the center of all equal noise figure circles falls on the origin of the Smith chart. (3) Calculate the input and output standing wave ratio and calculate the stability factor. (4) If the input and output standing wave ratios and the stability factor do not meet the index requirements, repeat steps (2) and (3) to meet the indicator requirements. (5) Determine the matching network. Incremental Encoder is commonly used, and Absolute Encoder is used if there are strict requirements on position and zero position. Servo system should be analyzed in detail, depending on the application situation. Commonly used incremental encoder for speed measurement, which can be used for infinite accumulation measurement; Absolute encoder is used for position measurement, and the position is unique (single or multiple turns). Finally, it depends on the application situation and the purpose and requirements to be realized. Incremental Linear Encoders,Linear Optical Encoder,Linear Position Encoder,Encoder Bearing Tester Yuheng Optics Co., Ltd.(Changchun) , https://www.yuhengcoder.com
![]() The effective gain for the input matching network;
The effective gain for the input matching network; ![]() Is the gain of the transistor;
Is the gain of the transistor; ![]() The effective gain of the matching network for the output. A proper matching network can make the gain of the amplifier greater than the gain of the transistor, and GSmax and GLmax can be greater than one.
The effective gain of the matching network for the output. A proper matching network can make the gain of the amplifier greater than the gain of the transistor, and GSmax and GLmax can be greater than one. 

![]() At this time, the transistor can obtain the maximum input power from the source, and can output the maximum power to the load, and the amplifier can achieve the maximum gain.
At this time, the transistor can obtain the maximum input power from the source, and can output the maximum power to the load, and the amplifier can achieve the maximum gain. 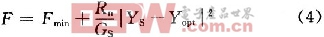
![]() Relationship
Relationship ![]() . When the reflection coefficient of the source
. When the reflection coefficient of the source ![]() When F=Fmin, the noise figure is the smallest.
When F=Fmin, the noise figure is the smallest. ![]() It is used to measure the ratio of the power Pin delivered to the input of the transistor to the source power PAVS. Load mismatch factor
It is used to measure the ratio of the power Pin delivered to the input of the transistor to the source power PAVS. Load mismatch factor ![]() , used to measure the ratio of the power PL delivered to the load to the transistor power PAVS. The relationship between the reflection coefficient of the amplifier input and output and the source and load mismatch factors is:
, used to measure the ratio of the power PL delivered to the load to the transistor power PAVS. The relationship between the reflection coefficient of the amplifier input and output and the source and load mismatch factors is: 

![]()
![]() . When the small signal is used, the gain curve of all inputs is a circle. The larger the gain value is, the smaller the radius of the circle is. When the maximum gain is equal, the radius of the gain circle is zero, which is reduced to one point. Assign the input to match the effective gain of the network, then give the input equal gain curve on the Smith chart, and select the source reflection coefficient on the equal gain curve to make the output and input dual.
. When the small signal is used, the gain curve of all inputs is a circle. The larger the gain value is, the smaller the radius of the circle is. When the maximum gain is equal, the radius of the gain circle is zero, which is reduced to one point. Assign the input to match the effective gain of the network, then give the input equal gain curve on the Smith chart, and select the source reflection coefficient on the equal gain curve to make the output and input dual. 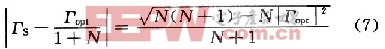
![]() On the line, the larger the noise figure is, the larger the radius of the circle is, and the noise figure is the smallest, which is reduced to a point on the Smith chart. Select the source reflection coefficient in the equal noise figure curve and note that the selected point falls on the equal gain curve.
On the line, the larger the noise figure is, the larger the radius of the circle is, and the noise figure is the smallest, which is reduced to a point on the Smith chart. Select the source reflection coefficient in the equal noise figure curve and note that the selected point falls on the equal gain curve.